
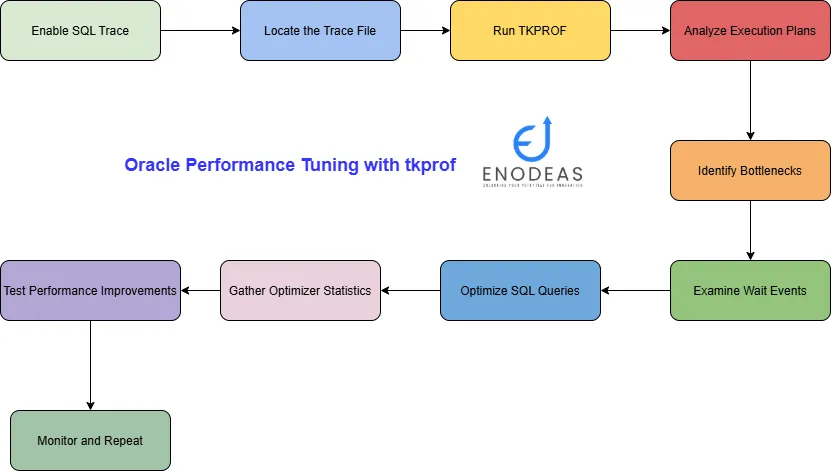
Oracle Performance Tuning with tkprof in Oracle Apps R12
Oracle performance tuning in Oracle Apps R12 may seem complex, but it’s essential for every DBA and developer. v$sql view can be used to tune sql queries. One of the most powerful tools at your disposal is tkprof command in oracle apps r12, a trace file analyzer. This guide will take you from beginner to expert, helping you identify and fix performance bottlenecks in your Oracle database efficiently.
Table of Contents
Oracle Performance Tuning with tkprof in Oracle Apps R12
What is tkprof command for Oracle Performance Tuning?
Generating Trace Files for Oracle Performance Tuning with tkprof
What is tkprof command for Oracle Performance Tuning?
When you notice any performance issue in a database object’s query, you need to generate a trace file to get details of the events occur inside the database. But if you want to analyze the trace file you may notice the trace file is very difficult to understand. Oracle provided a utility than can be used to read the trace file in a good format. tkprof command in oracle apps r12 is a powerful utility that converts raw SQL trace files from Oracle into a structured, readable report in text format. These trace files capture detailed execution data, including parse, execute, and fetch times, wait events, and resource usage. tkprof simplifies analysis by transforming complex trace data into an easy-to-read format, helping you quickly identify performance issues.
Generating Trace Files for Oracle Performance Tuning with tkprof
Before using tkprof for Oracle Performance Tuning in Oracle Apps R12, you must generate trace files. One common method is enabling tracing for the current session with:
ALTER SESSION SET SQL_TRACE = TRUE;
--OR
DBMS_SESSION.SET_SQL_TRACE procedureTo enable trace in current session
ALTER SESSION SET SQL_TRACE = TRUE
You can also enable tracing at the system level or for specific users for Oracle Performance Tuning in Oracle Apps R12 with tkprof. You can enable SQL Trace in another session by using the DBMS_SYSTEM.SET_SQL_TRACE_IN_SESSION procedure.
Caution: Enabling the SQL Trace facility increases system overhead
Enable SQL Trace only when tuning SQL statements
And disable it when you are finished
You might need to modify an application to contain the ALTER SESSION statement.
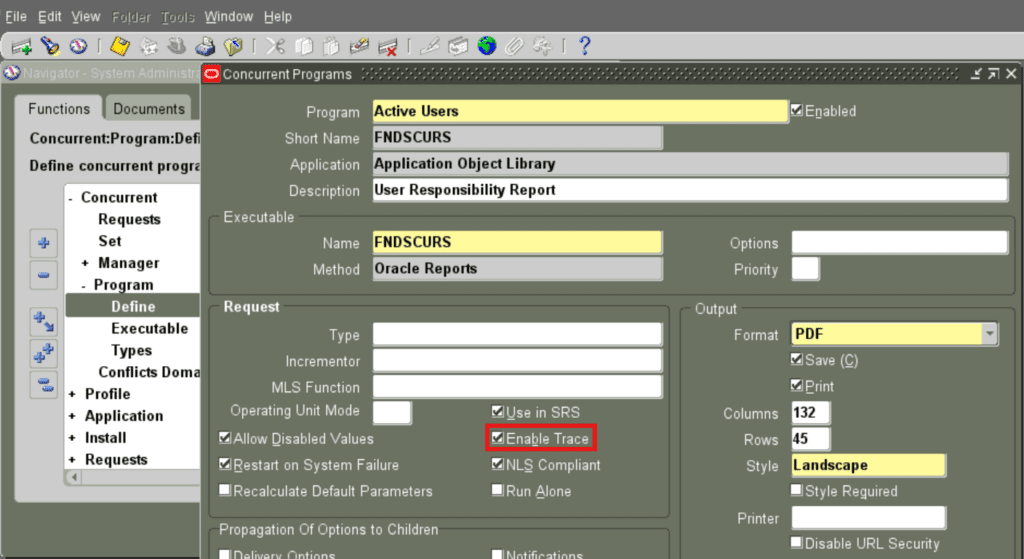
Performance issue can be noticed in Oracle Applications objects as well. In order to enable the trace inside forms based application or concurrent program you need to follow below steps:
Navigate System Administrator ->Concurrent -> Program -> Define
Seach for Concurrent Program and enable checkbox “Enable Trace”
Once you’ve captured the required data, disable tracing with:
ALTER SESSION SET SQL_TRACE = FALSE;For disabling trace in concurrent program
Navigate System Administrator ->Concurrent -> Program -> Define
Seach for Concurrent Program and uncheck checkbox “Enable Trace”
You can get also the trace file generated by a concurrent program in our earlier blog post.
The trace file is usually stored in the USER_DUMP_DEST directory.
Example: Tracing and Optimizing a Slow Query in Oracle Apps R12
Scenario: Identifying a Slow-Performing Query
Suppose we are experiencing performance issues with the following query in Oracle E-Business Suite:
SELECT order_number, customer_id, order_date, total_amount
  FROM oe_order_headers_all
WHERE order_status = 'PENDING';Since the oe_order_headers_all table contains a large number of records, this query may be causing a performance bottleneck.
Enabling SQL Trace for Oracle Performance Tuning
To capture detailed execution statistics, we enable tracing for our session. You can use below process to enable SQL trace in Oracle Apps R12 or database.
-- Enable SQL Trace
ALTER SESSION SET SQL_TRACE = TRUE;
-- Execute the slow query
SELECT order_number, customer_id, order_date, total_amount
  FROM oe_order_headers_all
 WHERE order_status = 'PENDING';
-- Disable SQL Trace
ALTER SESSION SET SQL_TRACE = FALSE;Once the query execution completes, the trace file is generated in the USER_DUMP_DEST directory.
SELECT value
  FROM v$parameter
WHERE name = 'user_dump_dest';Using tkprof to Analyze the Trace File for Oracle Performance Tuning
After retrieving the trace file (e.g., ora_67890.trc), we can format it using tkprof to generate a readable report:
tkprof ora_67890.trc ora_67890.tkprof explain=apps/p_apps_pwd sort=exe,fch,cpuTKPROF filename1 filename2 [ SORT = { option | (option [option]…)} ]
[ PRINT = integer ] [ AGGREGATE = { YES | NO } ]
[ INSERT = filename3 ]
[ SYS = { YES | NO } ]
[ [ TABLE = schema.table ] EXPLAIN = user/password ]
[ RECORD = filename ]
- ora_67890.trc: Input trace file containing raw execution details.
- ora_67890.tkprof: Output formatted report file.
- explain=apps/p_apps_pwd: database user name and password.
- sort=exe,fch,cpu: Sorts the report by execution time, fetch time, and CPU time usage.
Interpreting the tkprof Report for Oracle Performance Tuning
The tkprof output consists of multiple sections:
- SQL Statements: Lists all executed SQL statements with performance metrics.
- Execution Statistics: Provides detailed performance data for each SQL statement, including:
- Count: Number of executions.
- Elapsed Time: Total execution duration.
- CPU Time: CPU usage for the query.
- Parse Time: Time spent parsing SQL statements.
- Execution Time: Time spent executing the query.
- Fetch Time: Time spent retrieving results.
- Wait Events: Identifies database wait times that may be causing delays.
- Rows Processed: Number of records retrieved or modified.
- Misses in Library Cache: Indicates whether the query was recompiled (high values suggest inefficiencies).
- Execution Plan: Displays the step-by-step execution path taken by Oracle, highlighting inefficiencies like full table scans.
Example Analysis & Optimization
Identifying Performance Bottlenecks
If the tkprof report indicates:
- High elapsed time: The query takes longer than expected.
- Full table scan: The execution plan shows a costly scan of the entire oe_order_headers_all table.
- Significant CPU usage: The query consumes excessive CPU resources.
Optimization Strategies
- Indexing the Filter Column
Since the query filters on order_status, we can create an index to speed up lookups:
CREATE INDEX idx_order_status ON oe_order_headers_all (order_status); - Gathering Table Statistics
Ensure that Oracle’s optimizer has up-to-date statistics for better execution plan selection:
EXEC DBMS_STATS.GATHER_TABLE_STATS(‘APPS’, ‘OE_ORDER_HEADERS_ALL’); - Query Optimization
If the query frequently retrieves pending orders, consider restructuring it using indexed views or materialized views for better performance:
CREATE MATERIALIZED VIEW mv_pending_orders AS SELECT order_number, customer_id, order_date, total_amount FROM oe_order_headers_all WHERE order_status = ‘PENDING’;
Beyond the Basics: Advanced tkprof Analysis
To further enhance your Oracle Apps R12 performance tuning skills, consider these advanced techniques:
Wait Events Analysis: tkprof provides insights into wait events, helping identify query delays. For example:
- db file sequential read: Often indicates missing indexes, leading to slow performance.
- enqueue: Suggests contention issues that may require tuning concurrency settings.
Leveraging Bind Variables: Using bind variables reduces parse time and improves query performance by enabling Oracle to reuse execution plans efficiently.
System-Level Tracing: For a deeper analysis, enable tracing at the system level to capture all database activity, providing a comprehensive performance overview.
Conclusion
tkprof is a vital tool for optimizing Oracle database performance. By learning to generate trace files, analyze them with tkprof, and interpret the results, you can efficiently diagnose and resolve performance bottlenecks. This guide equips you with the essential skills to enhance database efficiency and responsiveness. With practice and hands-on experience, you’ll gain mastery over this powerful tuning tool, ensuring smooth and optimized database operations.
To deepen your understanding of database optimization, you can also learn about materialized views in Oracle, which play a crucial role in improving query performance and data management. You can analyze and tune your queries using v$sql views as well.


Pingback: Top 10 SQL Query Every Everybody Should Know in 2025
Pingback: Oracle PL/SQL FOR Loop: A Complete Guide with Examples
Pingback: Mastering Active Session History: Best Queries & Practices
Pingback: V$SQL Views Explained: Boost SQL Performance Fast